What data we have
Status shows whether the data is already in the research/ folder. Items marked "not yet" need an Earthdata login or Google Earth Engine.
Uzbekistan at a glance
Pick a measure to compare regions. Click a region or its crop point to load it into every section below.
Regions of Uzbekistan
Selected region in orange
What to plant next:
Tell us about the field. The advisor checks every crop against the field's expected climate for 2026–2030 (heat, frost, season length, water demand), its salinity, what grew there before, and your goal. Drop a pin on your field to use NASA data for that exact spot; otherwise it uses the region's crop point. Crop needs are starter values from FAO and will be replaced with our own crop data.
Your field
Click the map to mark your field.
Best options
All crops checked
Water need = crop water use minus useful rain, for the expected 2026–2030 climate: middle value, with the range in 8 of 10 years. Climate fit = share of likely years the crop matures without frost or heavy heat stress. Heat days come from NASA POWER's ~50 km cells, which run hotter than irrigated fields in desert oases such as Khorezm, so heat risk there is on the cautious side.
Climate outlook 2026–2030:
How the field's climate is shifting. Each line is a robust trend (Theil–Sen) through 2001–2025, extended to 2030. The shaded band is the range to expect in 8 of 10 years: the trend plus the real year-to-year swings around it. Weather in any single year cannot be predicted this far ahead, so read the band, not the line.
Mean air temperature
°C per year, NASA POWER
Heat-stress days
days with max ≥ 35 °C, NASA POWER
Crop water demand
reference ET0, April–September, mm, NASA POWER (FAO-56 Penman–Monteith)
Rain
mm per year, NASA POWER
Warmth for summer crops
growing degree days above 10 °C, April–October
Frost days
days with min below 0 °C, NASA POWER
Namangan pilot fields
This section always shows Namangan, where we have the most detailed data.
Terrain around Namangan
SRTM 30 m elevation, sampled every 0.025° (about 2.5 km)
Two pilot field points
Picked by checking the yearly greenness pattern from MODIS
NASA POWER weather uses a 0.5° grid, so both fields share one climate record. MODIS, SoilGrids and SRTM are sampled at each field.
Climate:
NASA POWER, MERRA-2 reanalysis at about 50 km. Annual values from the monthly series (1981 to 2024); extremes from the daily series (2001 to 2025).
Annual mean temperature
°C
Annual precipitation
mm per year, NASA POWER model and GPM IMERG satellite
Average month: temperature
°C, 1991–2020 normal versus the last ten years
Average month: precipitation
mm per month: POWER 1991–2020 normal and last ten years, GPM IMERG line
Crop-relevant extremes per year
Heat-stress days
days with max temperature ≥ 35 °C
Frost-free season
days between last spring and first autumn frost
Longest dry spell
consecutive days under 1 mm rain, March–October
Soil water:
Root-zone soil wetness from NASA POWER (0 = dry, 1 = saturated). This is modeled from MERRA-2, not measured by SMAP. Irrigation is not represented, so it describes rain-fed background conditions.
Average month: root-zone wetness
fraction of saturation
Growing-season root-zone wetness
April–September mean per year
ERA5-Land: soil moisture by depth and crop water demand
ECMWF ERA5-Land reanalysis at about 9 km, 2001–2025, via Open-Meteo. Reference evapotranspiration (ET0, FAO-56) is the water a well-watered grass crop would use. Where ET0 is far above rain, the gap must come from irrigation. ERA5-Land does not model irrigation either.
ERA5 data for this region is not downloaded yet. Rerun the download script, then rebuild the site.
Average month: soil moisture by depth
m³ of water per m³ of soil
Average month: crop water demand versus rain
mm per month. ET0 minus rain is a rough irrigation need.
NASA SMAP: measured soil moisture from space
SMAP L3 enhanced passive soil moisture (SPL3SMP_E), 9 km, top 5 cm, averaged over the 3×3 cells around the crop point. Sampled four days a month from April 2015. Unlike POWER and ERA5, SMAP sees real field conditions, so irrigation shows up as wetter summer soil.
SMAP data for this region is not downloaded yet. It needs an Earthdata token; see the README.
Average month: SMAP versus ERA5-Land topsoil
m³/m³. SMAP 2015–2025 measured; ERA5-Land 0–7 cm modeled, 2001–2025
SMAP soil moisture by month
m³/m³, monthly mean of sampled days
NASA SMAP surface soil moisture across Uzbekistan, 2025
SMAP Level 4 analysis (top 5 cm, 9 km), map images from NASA GIBS. Region outlines on top; the orange dot is the selected region's crop point.
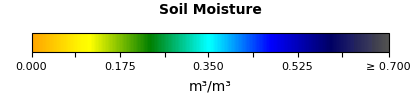
These are pictures from the Level 4 model-plus-satellite product. The charts above use the measured Level 3 values.
Vegetation:
MODIS NDVI measures greenness from 250 m pixels every 16 days. Values under about 0.25 usually mean bare soil or stubble. Those are the windows where a cover crop could fit.
Seasonal greenness
solid = selected year, dashed = 2001–2025 average
Greenness for this region is not downloaded yet. Rerun the download script, then rebuild the site.
Bare-field windows by year
Each row is a year. Darker cells are greener; pale cells are likely bare soil.
Crop calendar from MODIS phenology
MCD12Q2, 500 m. Each bar runs from green-up to dormancy. A second bar means a second crop that year.
Water use and surface heat: Namangan pilot fields
MODIS evapotranspiration (ET) is the water the land actually returned to the air. Potential ET (PET) is what it would use if water were unlimited. The gap between them hints at water stress. Caution: MODIS ET is known to underestimate irrigated cropland, because its model does not see irrigation water. Treat these values as relative patterns between years and fields, not as real crop water use.
Annual evapotranspiration
mm per year, MODIS MOD16A2GF, 500 m
Actual versus potential ET, Field A
mm per day, 2010–2025 monthly average
Land surface versus air temperature
°C monthly average daytime, MODIS LST 1 km and POWER max air temperature
Summer surface temperature by year
°C, June–August average daytime land surface, MODIS LST 1 km
Soil:
ISRIC SoilGrids modeled soil properties at 250 m with a 90% prediction range. Use these for screening only and confirm with local soil tests.
The soil profile for this region is not downloaded yet. Rerun the download script, then rebuild the site.
Organic carbon by depth
g per kg, bar = mean, whisker = 5–95% range
Soil texture, topsoil 0–30 cm
% of fine earth
All soil properties
Salinity and irrigation water
From Uzbek ministries on the national open-data portal (data.egov.uz): Ministry of Water Resources salinity survey of irrigated land, 2026 irrigation water limits, and Ministry of Agriculture water use. Salinity decides which crops can grow: barley, sorghum, cotton and sunflower tolerate it; most vegetables, beans and potatoes do not.
Saline share of irrigated land
% of each region's irrigated area, by salinity level. Selected region in bold.
Irrigation water in 2026: limit versus used
million m³ per region
Water withdrawn for irrigation, all Uzbekistan
km³ per year, State Committee on Statistics
Soil lab samples, Karakalpakstan
Fertilizer: nitrogen and ammonium nitrate (selitra)
National figures only. No source publishes fertilizer use by region or farm. FAOSTAT (built from Uzbek government reports) for use, production and trade; State Committee on Statistics for industrial output; Uzkimyosanoat for exchange sales. Ammonium nitrate (аммиачная селитра, NH₄NO₃) is the main nitrogen fertilizer made in Uzbekistan.
Nitrogen used on farmland
kg of nitrogen per hectare of cropland per year, all Uzbekistan
Nutrient balance, latest year
kg per hectare of cropland: nitrogen (N), phosphate (P₂O₅), potash (K₂O)
Ammonium nitrate: made and exported
thousand tonnes of nitrogen. Before 2017 the source reported product weight; converted at 34% nitrogen.
All nitrogen fertilizer: made, used, exported
thousand tonnes of nitrogen
Manure and compost
FAOSTAT livestock manure model for Uzbekistan. Nitrogen lost from manure heaps and spreading leaves mostly as ammonia, the main cause of the bad smell, so the smell is wasted fertilizer. Regional values are estimates: national per-animal factors times each region's cattle, sheep and goats (SIAT).
Where manure nitrogen goes
thousand tonnes of nitrogen, all Uzbekistan
Manure nitrogen by region, estimate
kg of nitrogen per hectare of irrigated land per year. Selected region in orange.
Crop yields under future climate:
FAO GAEZ v4 attainable yield for irrigated crops with high inputs, at the crop point's 9 km cell. Change from the 1981–2010 baseline to 2041–2070, averaged over five climate models, under moderate (RCP4.5) and high (RCP8.5) emissions. Includes the CO2 fertilization effect. These are model potentials, not farm yields, so compare crops with each other rather than reading absolute numbers.
GAEZ yields for this region are not downloaded yet.
Change in attainable yield by the 2050s
% versus 1981–2010
Attainable yield
kg dry weight per hectare, as GAEZ reports it
Farm economy:
Official yearly statistics from the State Committee on Statistics. They describe regions, not individual farms.
Sown area by crop
hectares
Wheat and cotton yield
tonnes per hectare, production divided by sown area
Production of rotation candidates
thousand tonnes
Farm output value
billion soum, current prices
Other rotation crops
production, thousand tonnes
Livestock
thousand head. More animals means more demand for fodder crops like alfalfa.
Market prices:
soum per kg, monthly, retail markets. Farm-gate prices are lower.
Price per kg in the latest 12 months
soum, market average
Exports
million USD per year
Gaps and next steps
This explorer shows data patterns only. It does not replace farmer judgment or local agronomy advice.